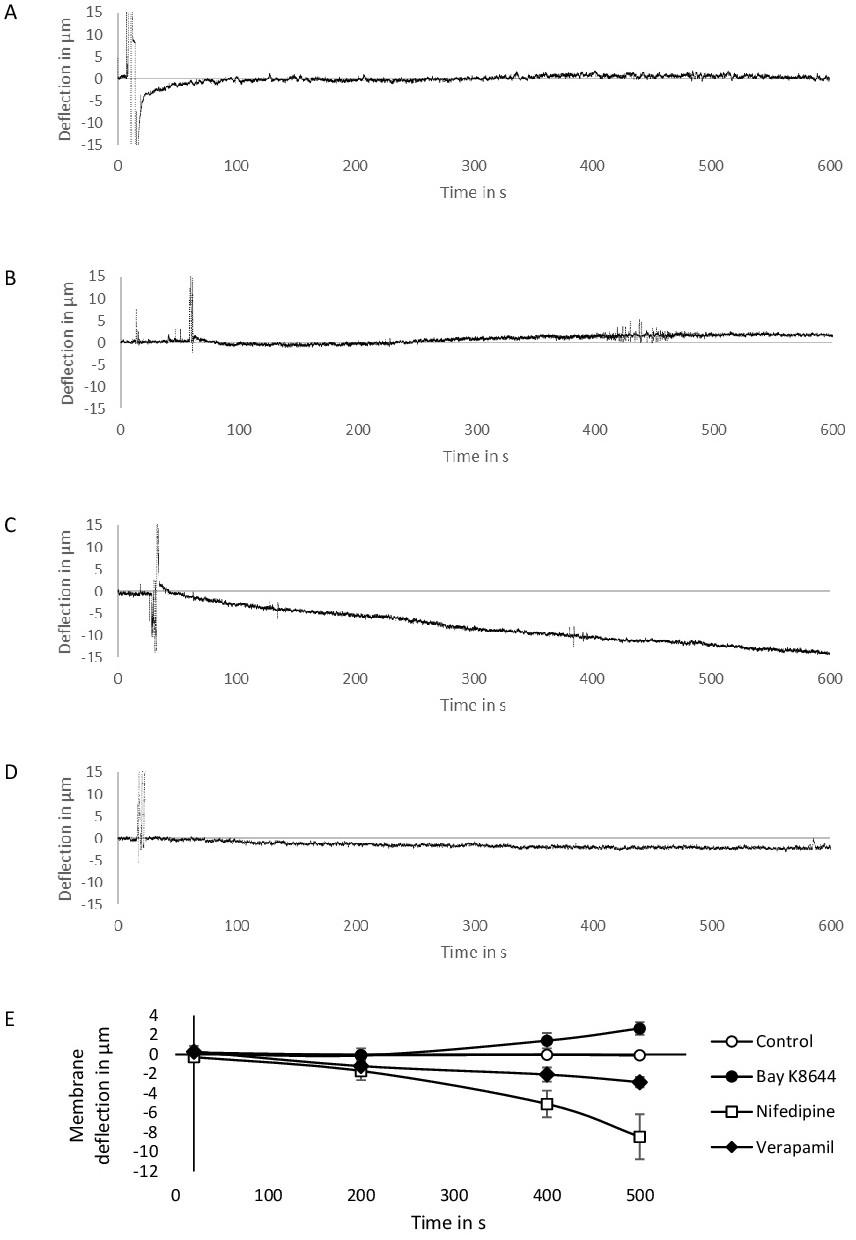
Fig. 5. The graphs show the RTM of samples treated with vasoactive agents. A) showing the control measurement. The samples below were treated with 100nM Bay K8644 (B),10nM nifedipine (C) and 50nM verapamil (D). The Y-Axis shows the membrane displacement relative to its initial position in µm and the X-Axis showing time progression in seconds. (E) The data points represent the mean value and standard deviation of three individual biological samples at the time points 20, 200, 400 and 500 seconds. For this purpose, samples with 20 values per measurement were examined.